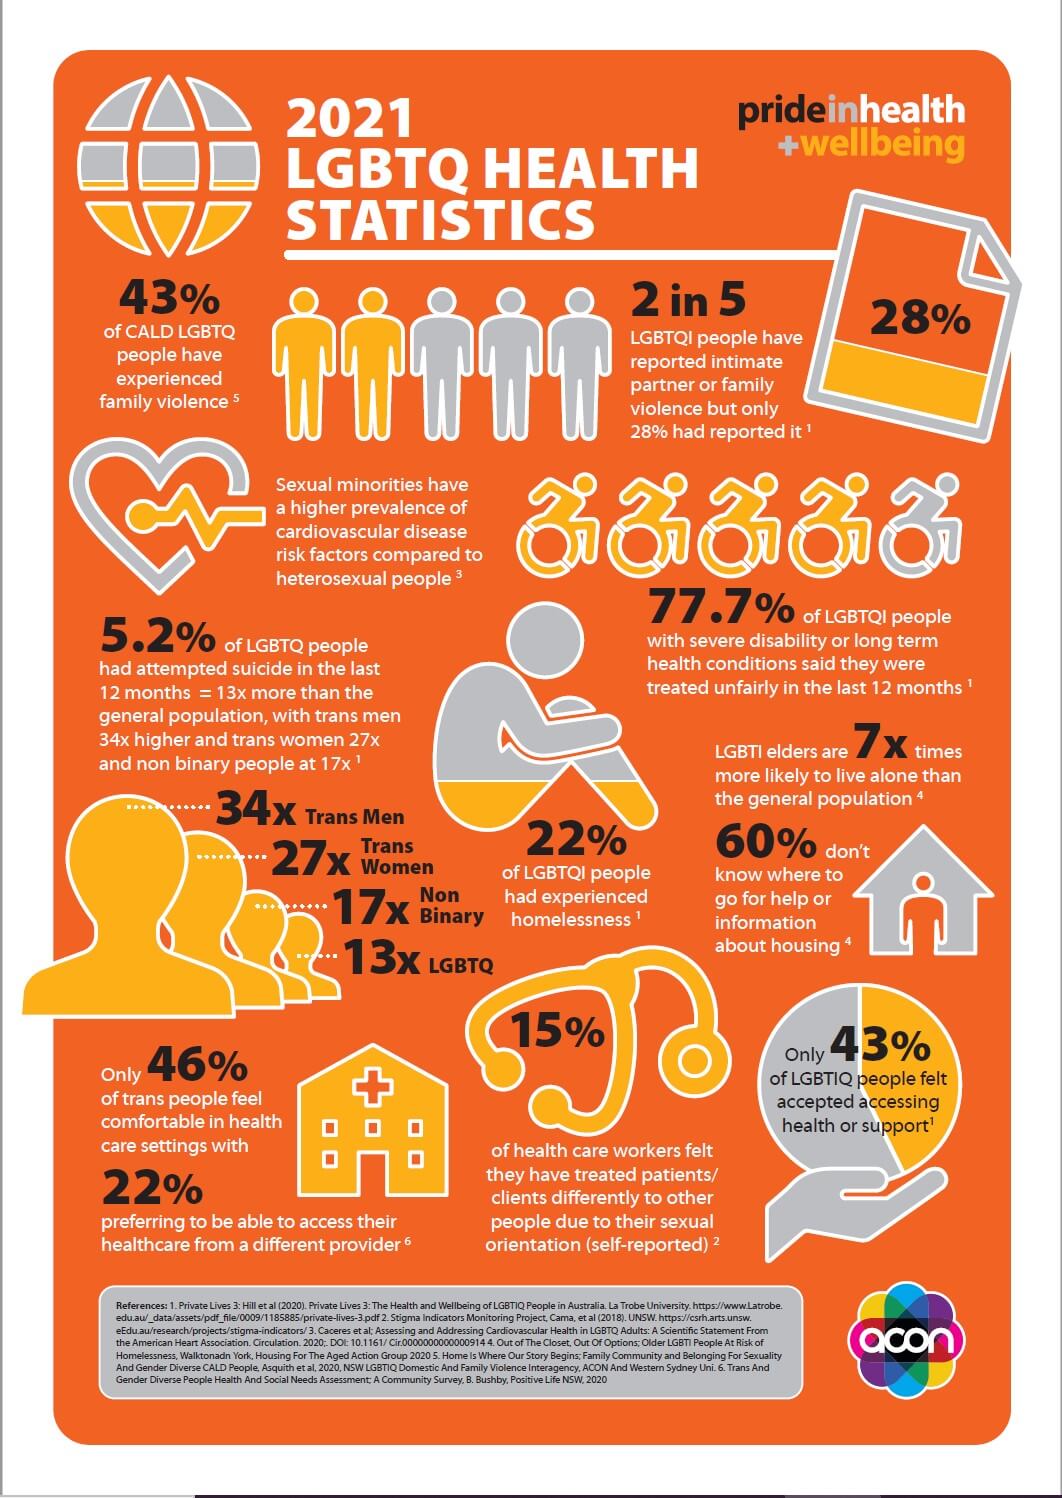
This IDAHOBIT day we are releasing the 2021 version of the LGBTQ health and wellbeing infographic so you can see the LGBTQ statistics
This graphic summarises key statistics, data and reports released in the last 12 months showing the barriers faced by the LGBTQ community in accessing care or health disparities still being felt.
This IDAHOBIT day we challenge individuals and organisations to Break Down the Barriers for #LGBTQ people so they can access services.
Share with us how you are “Breaking Down The Barriers” for LGBTQ inclusion.
Here are some ideas:
- show your inclusion – add rainbow and trans flag in your public areas
- update your forms – review your forms and remove non-inclusionary options
- showcase the LGBTQ community – hear from staff and service users about their ideas or experiences
- Discuss the statistics – brainstorm how your service can do better from a quality improvement perspective
- Measure your impact – if you are wanting to see if you are inclusive why not take our 2-minute audit or commit to participating in the Health and Wellbeing Index in 2022
For more information on days of significance visit: PIHW Days of Significance
To purchase badges, stickers and other merchandise to show your inclusion visit our shop
For events and to get involved visit our Events page


